

Power BI development for dashboards your team actually uses
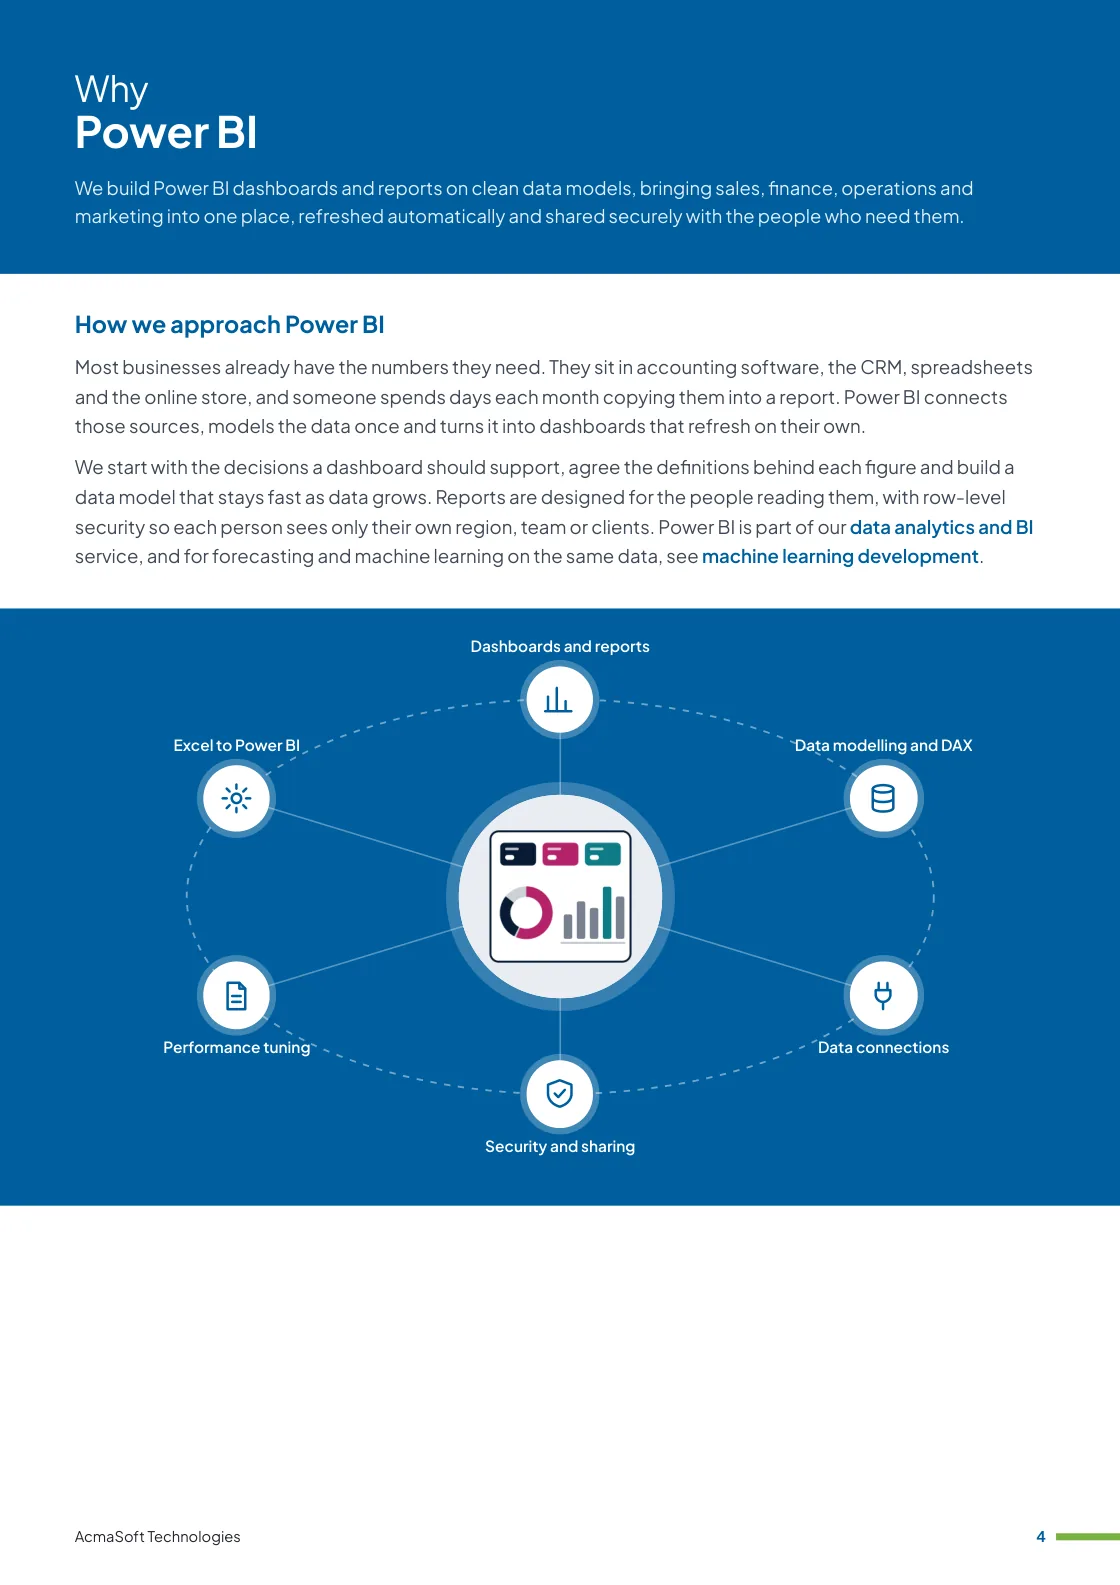
At AcmaSoft, we build Power BI dashboards and reports on clean data models, bringing sales, finance, operations and marketing into one place, refreshed automatically and shared securely with the people who need them.
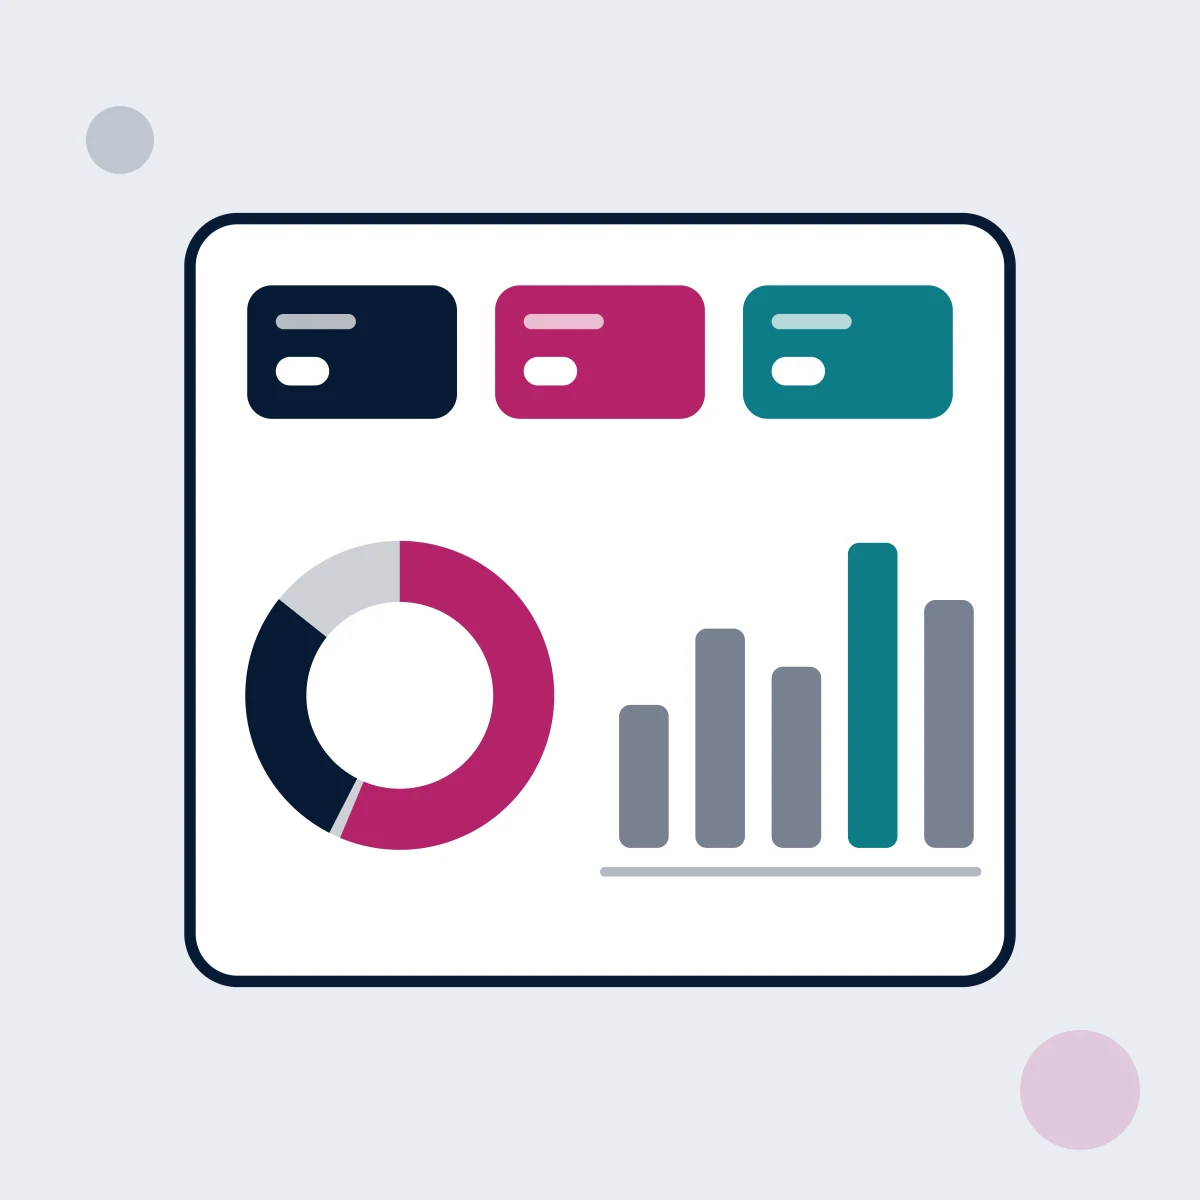
How we approach Power BI
Most businesses already have the numbers they need. They sit in accounting software, the CRM, spreadsheets and the online store, and someone spends days each month copying them into a report. Power BI connects those sources, models the data once and turns it into dashboards that refresh on their own.
We start with the decisions a dashboard should support, agree the definitions behind each figure and build a data model that stays fast as data grows. Reports are designed for the people reading them, with row-level security so each person sees only their own region, team or clients. Power BI is part of our data analytics and BI service, and for forecasting and machine learning on the same data, see machine learning development.
AcmaSoft highlights
- 17+ years delivering software, design and marketing
- 650+ clients served across industries
- 2,000+ projects delivered from discovery to launch
- 300+ products shipped and supported
- Power BI work delivered through our Data Analytics and BI service
- 6 Power BI services under one team, from planning to support
Our Power BI services
Power BI work from a first dashboard to a governed reporting setup for the whole company.

Dashboards and reports
Sales, finance, operations and marketing dashboards designed around the questions managers ask every week.

Data modelling and DAX
Star-schema models, measures written in DAX and agreed definitions, so every report shows the same numbers.

Data connections
Connections to Xero, QuickBooks, Tally, Zoho, SQL databases, Excel, Google Sheets, CRM, e-commerce and ad platforms, with scheduled refresh.

Security and sharing
Row-level security, workspaces and apps so each team sees the right data, on desktop, mobile and in Teams.

Performance tuning
Faster reports through model clean-up, incremental refresh and query folding.

Excel to Power BI
Monthly spreadsheet reports rebuilt as automated dashboards, keeping the figures your team already trusts.
Entrust your Power BI project to a team with 17+ years of delivery
Reach out to usHow a Power BI project runs
From the first conversation to launch and support, in 6 steps.
-
Questions and metrics
We agree the decisions, audiences and metric definitions the dashboards must support.
-
Source review
We list data sources, check data quality and plan how to connect each one.
-
Data model
We build and test the model and measures against figures your team already knows.
-
Report design
We design dashboards with users and refine them over short review rounds.
-
Security and publishing
We set up workspaces, row-level security and scheduled refresh.
-
Training and support
Users learn to read and filter reports, and we add new reports as needs grow.
Our customers say
AcmaSoft delivered software solutions that streamlined our operations. Their attention to detail and commitment to quality set them apart.
Why partner with AcmaSoft for Power BI
A dashboard is only useful if people trust the numbers. We spend as much care on definitions and data quality as on visuals.
-
One version of the numbers
Shared definitions mean finance, sales and operations stop arguing about whose figure is right.
-
Local and global business systems
We connect accounting and sales systems such as Xero, QuickBooks, Sage, Tally and Zoho, tax data and regional marketplaces, not only global platforms.
-
Designed for readers
Clear layouts, plain labels and mobile views for managers who check numbers on the go.
-
Beyond dashboards
The same team can automate data entry, build forecasts or add AI on top of your data.
See how Power BI fits into our data Analytics and BI service
Explore data Analytics and BIOur cooperation models
Keep full control of the team, hand us a whole team, or give us the entire project. You can change the model as the work grows.
A dedicated team for your Power BI product
A self-managed team with a project lead, developers, designers and testers, working only on your product for as long as you need it.
-
Team planning
We agree the roadmap, roles and working rhythm, and how progress is reported to you.
-
Team assembly
We put the team together with a lead who knows your domain, and set up access and tools.
-
Delivery
The team works in short cycles, shows working software at each review and adapts to your feedback.
Build your dedicated Power BI team
Discuss a teamEnd-to-end Power BI project delivery
We take responsibility for the whole project: an agreed scope, timeline and budget, from discovery to launch and support.
-
Discovery
We agree goals, features and constraints with you, and turn them into a clear scope.
-
Estimate and plan
You get a written estimate, timeline and milestones before any work is committed.
-
Build and launch
We design, build and test in stages, launch with you and support the product afterwards.
Outsource your Power BI project to AcmaSoft
Request a quoteRelated technologies
We choose the stack for your budget, goals and current systems. These are the technologies we most often use alongside Power BI.
Data and analytics
Often used with
Everything we work with
Working with international clients
Our team delivers remotely, so the questions that matter are when we can talk and how the work is run. Here are our office hours beside yours.
Our office hours Monday to Saturday, 9:30 am to 6:30 pm India time (IST)
Evening hours for North American clients, by arrangement: Monday to Friday, 6:30 pm to 9:30 pm India time
| Your region | Our hours in your time | Shared working hours |
|---|---|---|
| UKLondon | 4 am to 1 pm | 9 am to 1 pm |
| Central EuropeParis, Berlin | 5 am to 2 pm | 9 am to 2 pm |
| US EastNew York, Toronto | 11 pm to 8 am (next day) Evening hours to 11 am | 9 am to 11 am In our evening hours, by arrangement |
| US WestLos Angeles, Vancouver | 8 pm to 5 am (next day) Evening hours to 8 am | No overlap Early calls 7 am to 8 am, by arrangement |
| GulfDubai, Abu Dhabi | 8 am to 5 pm | 9 am to 5 pm |
| Singapore | 12 noon to 9 pm | 12 noon to 6 pm |
| Australia EastSydney, Melbourne | 3 pm to 12 midnight | 3 pm to 6 pm |
Our day ends before yours starts, so updates are waiting each morning and we agree call times with you.
Times follow daylight saving where your region uses it, against a working day of 9 am to 6 pm. Messages sent outside our hours are picked up when the team is back.
-
Remote delivery
Discovery, design, development and testing run remotely, with one named lead, a demo of working features at the end of each sprint and a staging site you can try.
-
How we stay in touch
Email, video calls and chat such as Slack, Microsoft Teams or WhatsApp, with the hours of overlap and meeting times agreed in the communication plan at the start.
-
Contracts and invoices
Proposals, contracts and invoices are in English and priced in US dollars, or in your own currency on request. A non-disclosure agreement can be signed before you share any details.
-
Privacy laws we design for
We design forms, consent and data handling with the law of your market in mind: GDPR and UK GDPR, CCPA and CPRA, PIPEDA, the UAE PDPL, the Australian Privacy Act, Singapore's PDPA and India's DPDP Act.
Questions about Power BI
Something else on your mind? Ask us directly and a specialist will reply.
Ask a questionHow much does Power BI development cost?
The estimate depends on the number of data sources and how clean they are, the data model and DAX measures, the number of reports and audiences, and row-level security and sharing. Moving from Excel reports often needs data clean-up first, and Power BI licences are paid to Microsoft separately. After a call about your questions and metrics, we send an itemised proposal with its assumptions.
How long does a Power BI project take?
We agree the questions and metrics first, then review the sources and build the data model. A first report goes live for one team, then further reports, security and publishing follow in short sprints with demos on your own data. Training for report owners closes each phase. Your proposal names the milestones and the start date.
Do you support the project after launch?
Yes. We offer maintenance, security updates and managed hosting, so the team that built your project keeps it running and improving.
Power BI development brochure
We build Power BI dashboards and reports on clean data models, bringing sales, finance, operations and marketing into one place, refreshed automatically and shared securely with the people who need them.
Inside this brochure
- How we approach Power BI
- Our Power BI services
- How a project runs
- Ways to work with us
- 3.1 MB
- 11 pages
- Technologies
You have downloaded from us before, so this one needs no form.
Get the brochure
Tell us who you are and the download starts straight away. We remember you on this device for 90 days, so you only fill this in once.
Your download has started.
If it does not start, download the brochure here. The links work for 15 minutes.
- Your reference
- Brochure
What you can do next
- Read it and share itShare the brochure with your team before you get in touch. It is free to read and share.
- Get a quote when you are readySix short questions on our request a quote page, and a reply within one business day.
Start your Power BI project
Tell us what you are planning and a specialist will reply with next steps, a rough timeline and the questions we need answered.
- Emailsales@acmasoft.com
- Call+1 (707) 706 4092
- Prefer a call?
Thank you, your message is on its way.
It has reached our sales team, together with the page you sent it from.
- Your reference
- Budget
While we prepare your reply, here is the Power BI development brochure.
Download the brochure, Power BI development brochure, PDF, 3.1 MBWhat happens next
- A specialist gets in touchWithin one business day, by email or phone, with any questions about what you need.
- We talk it throughA short call about your goals, users, timeline and budget. We can sign an NDA first.
- You get a proposalScope, team, timeline and cost, with the engagement model that fits the work.